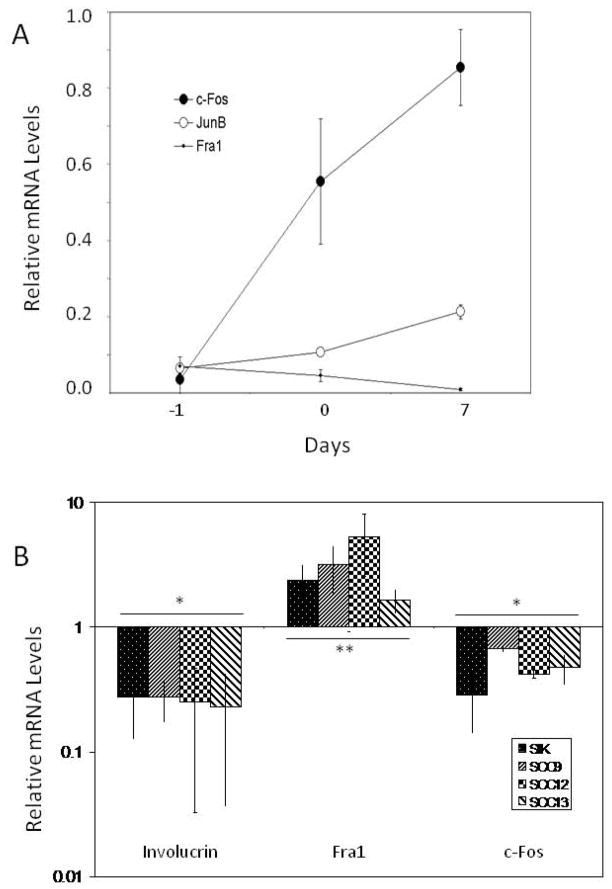
Fig. 3.
Alteration of transcription factor mRNA levels with time and by treatments. (A) Real time PCR measurements of the indicated mRNAs in untreated SCC9 cultures were performed a day before confluence (−1), at confluence (0) and 7 days after confluence (7). (B) Arsenite treatment began at confluence. Samples were harvested 3 days later for measurement of Fra1 and c-Fos mRNAs or 7 days after confluence for measurement of involucrin mRNA. mRNA levels in parallel untreated control cultures were measured and assigned a value of 1 for comparison. Shown are the means ± standard deviations of 4–8 experiments, which differed significantly from untreated control cultures (*, p < 0.01; **, p = 0.05).

