Figure 3.
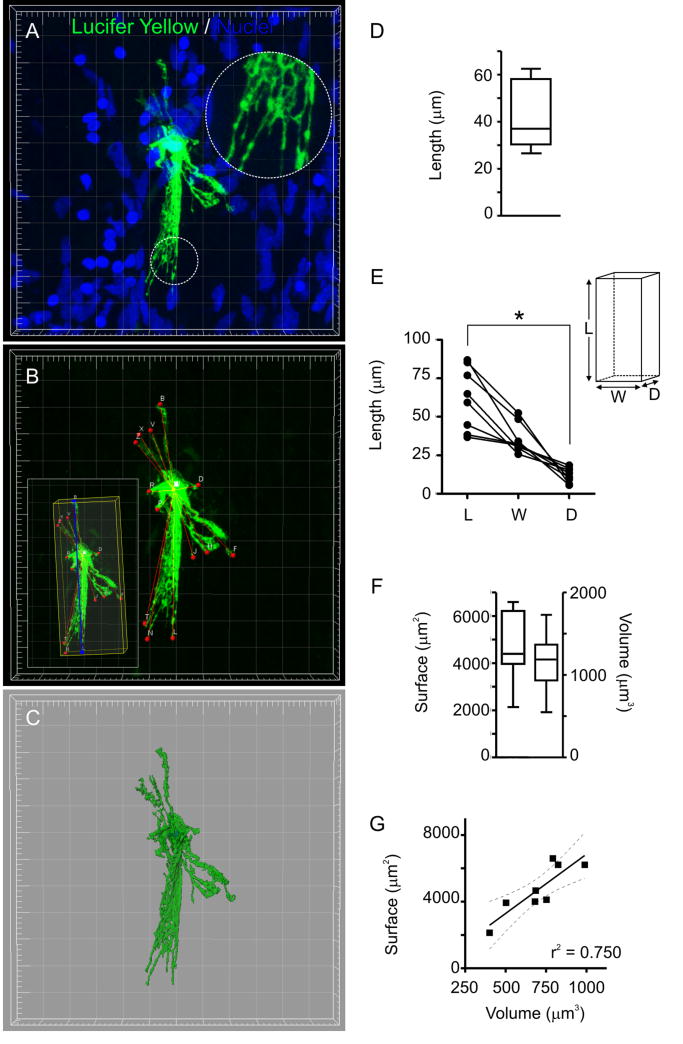
OECs are elongated cells with fine projections forming a matrix. A, Volume 3D-reconstruction of a LY-filled OEC (Grid: 5 μm). Nuclei were stained with DRAQ5. Inset: matrix of lamellar projections (dashed circle). B, Points (red) defined to estimate the length of OEC projections. Inset: the OEC main axis is in blue and a bounding box enclosing the cell is in yellow (see Materials and methods). C, Isosurface rendering using the green channel. The blue channel was used to generate a contour surface of the nucleus. D, Length of the longest segment from the cell body to the tip of lamellae, as indicated in B (n = 8). E, Length, width and depth of the bounding boxes enclosing each OEC, as shown in B (inset) (n = 8). * p < 0.001 (Friedman test). F, Surface and volume of isosurface renderings as the one shown in C (n = 8). G, Surface vs. volume plot (full line: linear fit; broken lines: 95% confidence interval; r2 = 0.75; n = 8).

