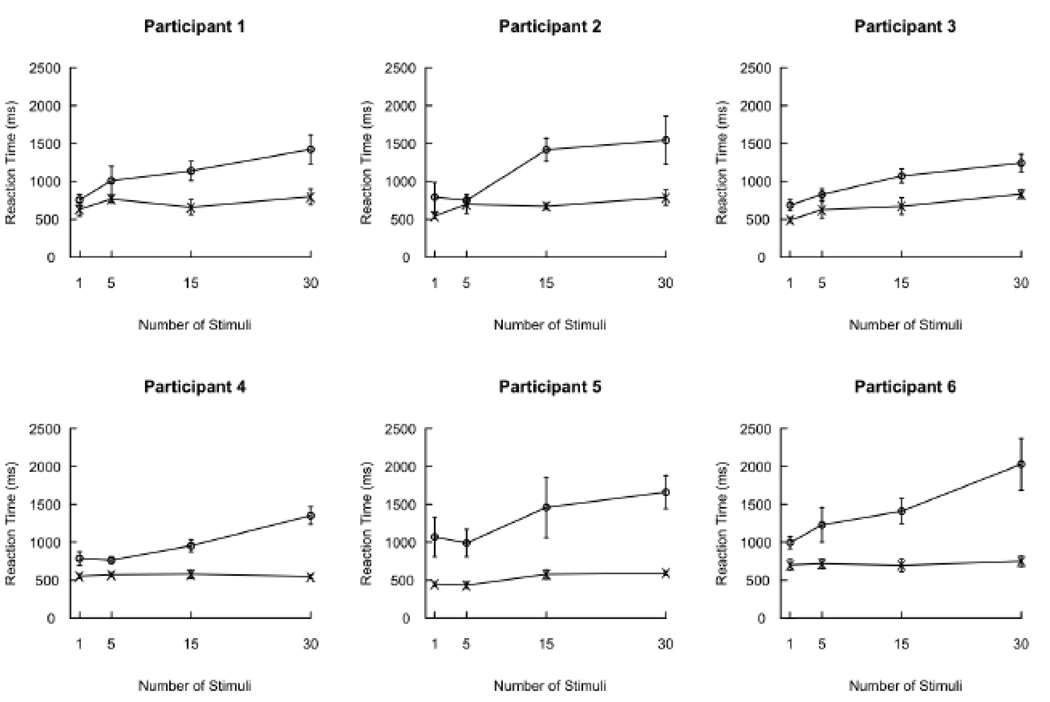
Figure 3.
Plots of reaction times by set size for each participant in the Treisman and Gelade (1980) search tasks. The bottom curve on each set of axes indicates reaction times in the single-feature search; the top curve on each set of axes indicates reaction times in the conjunction search.

