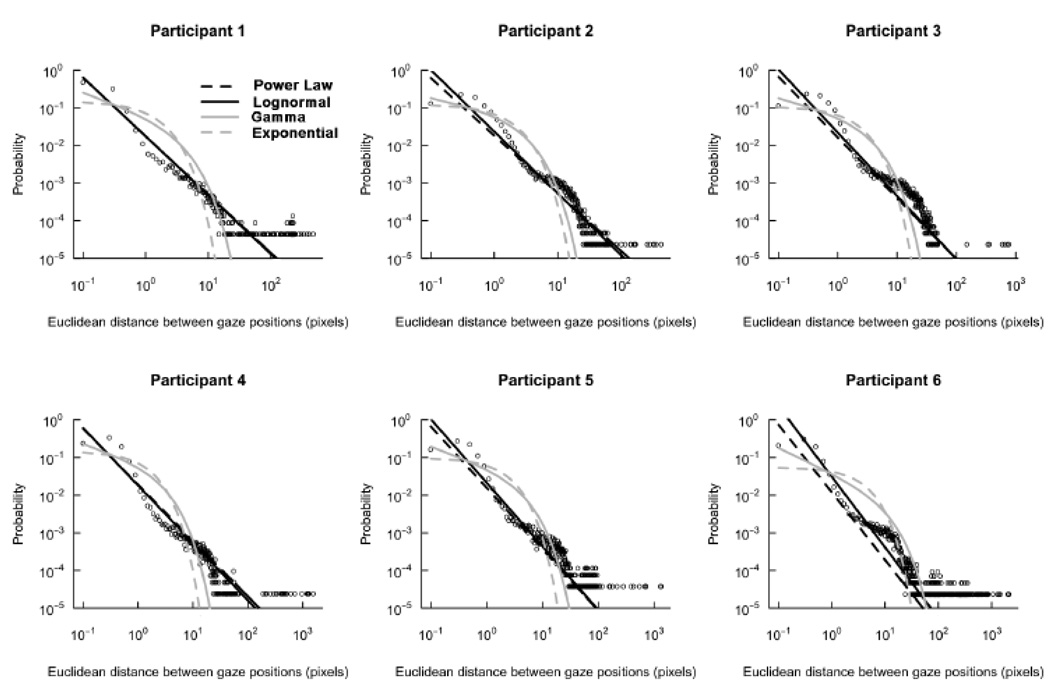
Figure 5.
Empirical probability distribution functions (pdfs) of gaze steps in the single-feature search task by participant on double-log plots. Distribution fits are shown for inverse power law (dashed black curve), lognormal (solid black curve), gamma (solid gray curve), and exponential (dashed gray curve). Lognormal and inverse power-law fits for Participants 1 and 4 are sufficiently close to one another that the lognormal curve eclipses the inverse power-law curve.

