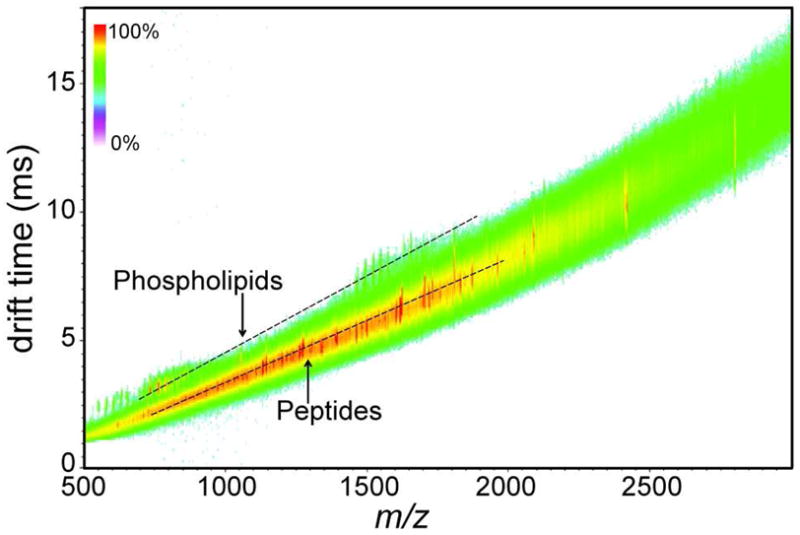
FIGURE 1.

Measuring CCS values of phospholipids and tryptic peptides directly from rat brain tissue sections by MALDI t-wave IM-MS. A typical two-dimensional td versus m/z plot of a rat brain tissue section after trypsin application collected by MALDI t-wave IM-MS. The predicted correlation of drift time versus m/z for phospholipids and tryptic peptides at these experimental conditions are indicated by dashed lines for visualization purposes. Signal intensity is indicated by the displayed false color scale.
