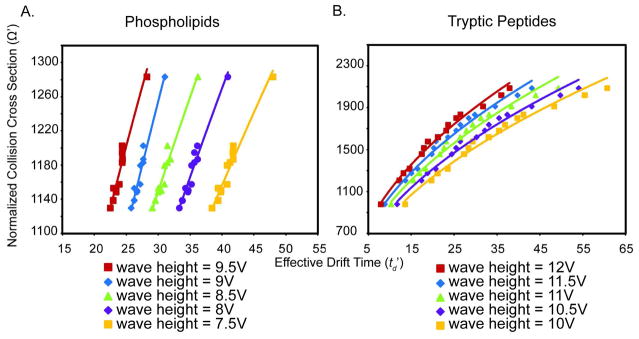
FIGURE 2.
Calibration curves of normalized CCS versus effective drift time used to estimate CCS values of (A) phospholipids and (B) tryptic peptides directly from tissue sections. Data from 5 different wave heights are each plotted whereby the correlation line represents a power fit to the data. Since t-wave IM-MS CCS values were calculated using the td values obtained directly from a complex sample, only td values for peaks containing a single species when analyzed by FTICR were used. Calibration curves of phospholipid standards have R2 values > 0.95 and calibration curves of BSA tryptic peptides have R2 values > 0.98.

