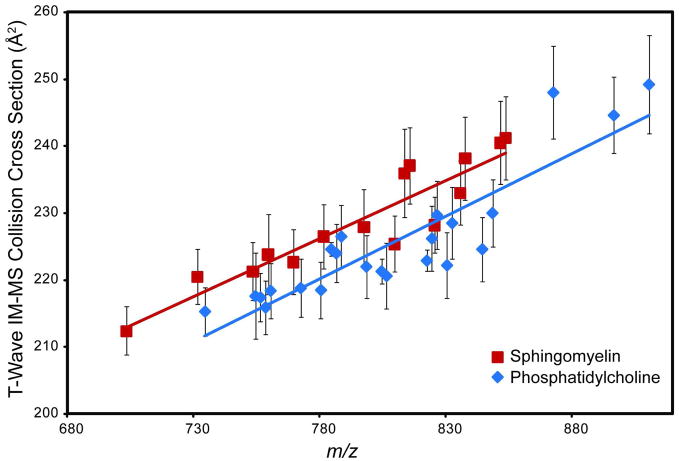
FIGURE 4.
MALDI t-wave IM-MS CCS values of phospholipids obtained directly from tissue sections. Specific phospholipid species were identified by FTICR and MS/MS directly from tissue sections. MALDI t-wave IM-MS CCS values were determined using drift cell IM-MS phospholipid CCS values as calibrants. Error bars represent ± 1σ for 5 different wave heights collected over 2 days (n=10). The two SM species which fall on the PC trend-line were identified as [SM 22:0 + Na]+ and [SM 22:0 + K]+.

