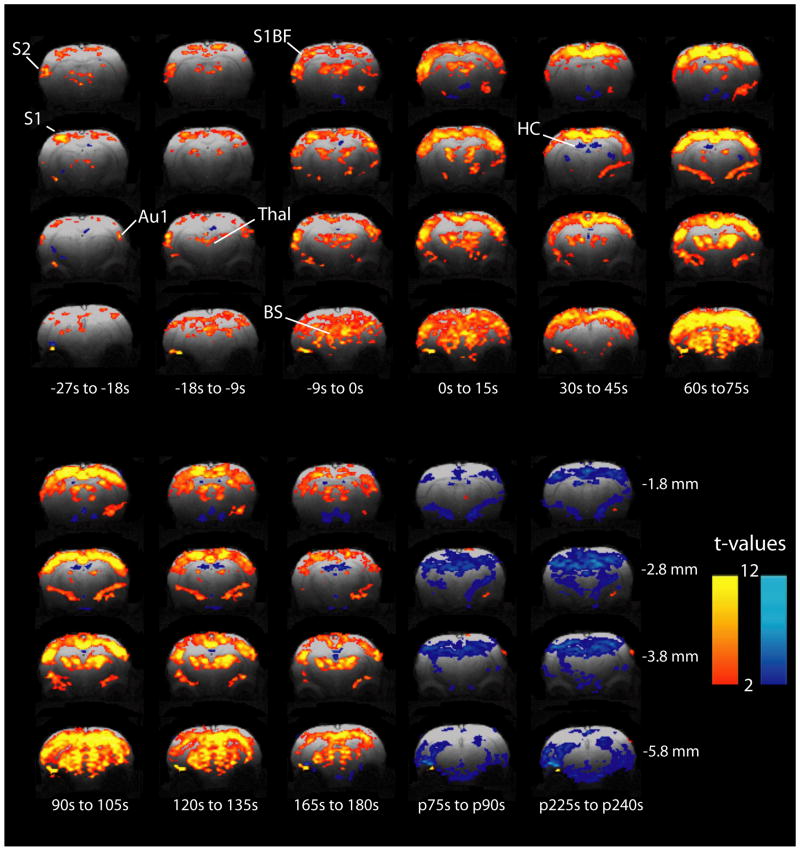
Figure 2.
Focal fMRI increases begin in the preictal period and remain relatively increased after tonic-clonic seizure onset. Two-sample paired t-maps comparing BOLD signal of the specified time frame relative to electrographic seizure onset, to 30 s baseline signal. Times preceded by “p” indicate post-ictal and are relative to seizure offset. T-maps have been overlaid onto high resolution FLASH anatomical images with height threshold t>2.00 (p<0.05) and extent threshold of 13 voxels (2 mm3). Although images were acquired from +1.2 to -6.8 mm relative to bregma, representative slices are shown at -1.8, -2.8, -3.8 and -5.8 mm which encompass all volumes of interest. Similarly, representative timepoints only are shown during and after seizures. S1 = Primary somatosensory cortex subregions including hindlimb (S1HL), forelimb (S1FL), dysgranular zone (S1DZ), and trunk (S1Tr); S1BF = Primary somatosensory cortex, barrel field; S2 = Secondary somatosensory cortex; Au1 = Primary auditory cortex; Thal = Thalamus; HC = Hippocampus; BS = Brainstem. Warm colors represent fMRI increases and cool colors decreases.

