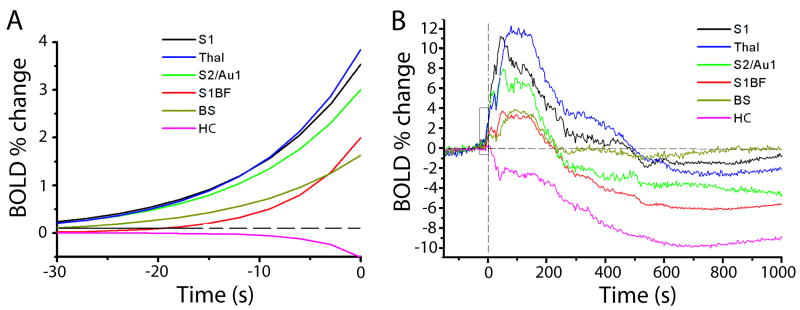
Figure 4.
Timecourses of percent change in BOLD signal compared to 30 s baseline signal in various regions. Times are relative to seizure onset. A. Exponential fits to mean timecourses 30s before seizure onset (fit to data from times in box, B). ANOVA across seizures and regions (F=10.75, P<0.01, df =5, 96) with post-hoc pairwise comparisons reveals 3 groupings from fastest to slowest: S1, S2/Au1 and thalamus (mean=0.16 s-1); S1BF and brainstem (0.05 s-1); and hippocampus (∼0.01 s-1). B. Full timecourses of mean percent changes in BOLD reveal different peak amplitudes in different regions. ANOVA across seizures and regions (F= 24.34, P<0.001, df= 5, 96) with post-hoc comparisons demonstrated the following 4 groups from largest increase to largest decrease: S1 and thalamus (mean=12.35%); S2/Au1 (8.56%); S1BF and brainstem (4.21%); and finally hippocampus (-10.14%). S1= Primary somatosensory cortex excluding S1BF, but including hindlimb (S1HL), forelimb (S1FL), dysgranular zone (S1DZ), and trunk (S1Tr); S1BF = Primary somatosensory cortex, barrel field; S2 = Secondary somatosensory cortex; Au1 = Primary auditory cortex; Thal = Thalamus; HC = Hippocampus; BS = Brainstem.

