
Figure 4. Effect of CSE and H2O2 on eNOS acetylation and its regulation by SIRT1 in HUVECs.
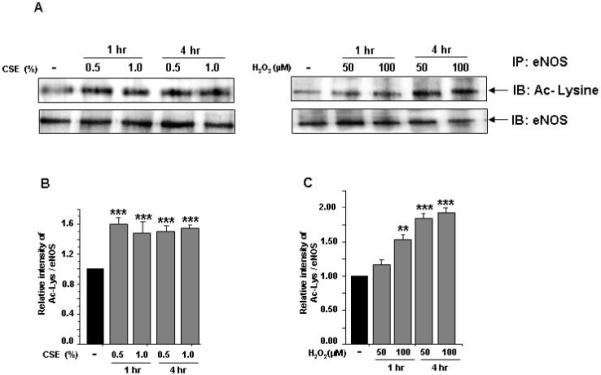
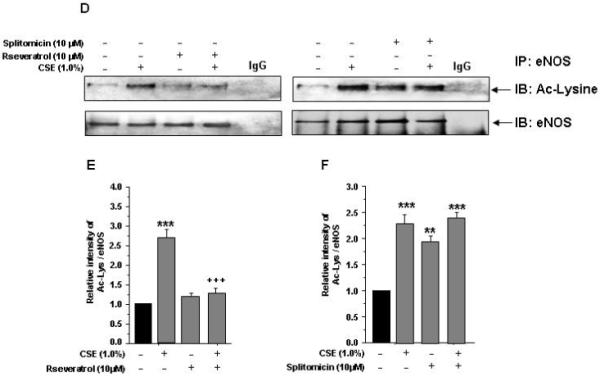
eNOS acetylation: A) HUVECs were treated with CSE (0.5% and 1.0%) and H2O2 (50 and 100 μM) for indicated time points. B) and C) Histograms represent the relative intensity of acetylated lysine levels of eNOS compared to respective controls (n=3). SIRT1 regulation of eNOS acetylation: D) HUVECs cells were pre-treated with or without SIRT1 activator (resveratrol, 10 μM) and inhibitor (splitomicin, 10 μM) for 1 hr and then treated with CSE (1.0%) for 4 hr. E) and F) Histograms represent the relative intensity of acetylated lysine levels of eNOS compared to respective controls (n=3). IgG was used as an isotype control. Data shown are Mean ± SE. **P < 0.01, ***P < 0.001 vs. control groups. +++P < 0.001 vs. CSE treatment alone.