Figure 3.
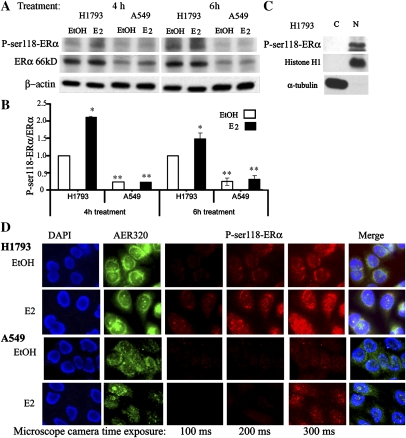
Phospho-serine-118-ERα (P-ser118-ERα) in lung cancer cells. (A) Western blot of whole-cell extract from H1793 and A549 cells using P-ser118-ERα, ERα 66-kD using monoclonal antibody AER320, and β-actin antibodies. Note that AER320 detects full-length, wild-type (WT) ERα (Figure 1 and Ref. 13). The cells were treated for either 4 or 6 hours with EtOH or 10 nM E2 as indicated. (B) The relative levels of P-ser118-ERα/ERα were quantitated. Values are the average of three to six separate experiments (±SEM). The P-ser118-ERα/ERα 66-kD ratio in EtOH-treated H1793 cells was set to 1 within each experiment and at each time point (4 or 6 h) for comparison between experiments. Values are significantly different from the P-ser118-ERα/ERα 66-kD ratio in EtOH-treated H1793 cells:*P < 0.05, **P < 0.001. (C) Western blot of cytoplasmic (C) and nuclear (N) extracts from H1793 cells for P-ser118-ERα, and subfraction controls (histone H1, nuclear; α-tubulin, cytosol) in EtOH-treated H1793 cells. (D) Dual-label fluorescence immunostaining of control (EtOH)- and E2-treated H1793 and A549 cells. ERα AER320 antibody (green) and P-ser118-ERα antibody (red) were used as described in Materials and Methods. Images of nuclei (DAPI) and ERα, and the merged image were captured at identical times of exposure (16 and 230 ms, respectively) for each cell line. To examine differences in the level of P-ser118-ERα in EtOH- versus E2-treated cells, images of P-ser118-ERα were captured at 100, 200, and 300 ms of exposure, as indicated at the bottom of the photos. Scale bars, 20 μm.

