Figure 4.
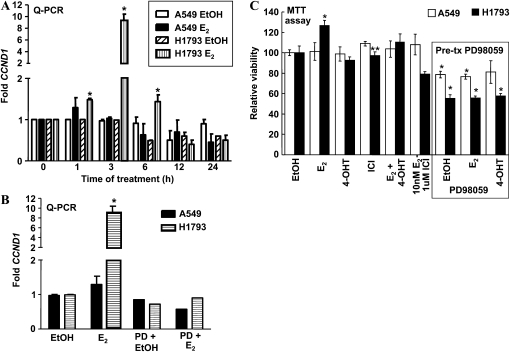
E2 induces higher CCND1 transcription in H1793 than in A549 lung adenocarcinoma cells. (A) A549 and H1793 cell lines were treated with EtOH or E2 for the indicated time, and CCND1 expression was determined by real-time qRT-PCR, and is expressed relative to time zero EtOH for each cell line, as described in Materials and Methods. Values are the means (±SEM) of three to four separate experiments in which each sample was run in triplicate. The maximum induction of CCND1 was detected after 3 hours of E2 treatment in H1793 cells. *P < 0.05, significantly different from EtOH time zero for that cell line. (B) A549 and H1793 cell lines were pretreated with 50 μM PD98059 for 1 hour and treated with EtOH or E2 for 3 hours. CCDN1 is expressed as fold relative to EtOH for each cell line. Values for PD98059 pretreatment are the average of triplicate determinations. (C) A549 and H1793 cells were treated as indicated with EtOH, 10 nM E2, 100 nM 4-hydroxytamoxifen (4-OHT), 100 nM ICI 182,780 (ICI) (alone or in combination). Where indicated, cells were pretreated with 50 μM PD98059 for 1 hour before adding the other indicated treatments. MTT assays were performed as described in Materials and Methods. Values are the means (±SEM) of three to six separate experiments in which each sample was run in quadruplicate. *P < 0.05, significantly different from EtOH time zero for that cell line; **P < 0.05, significantly different from E2 alone value for that cell line.

