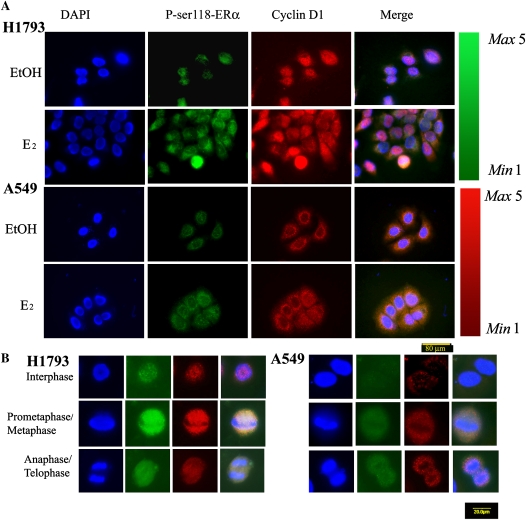
Figure 5.
E2 increases nuclear P-ser118-ERα and cyclin D1 in H1793 lung adenocarcinoma cells. (A) Immunofluorescence staining of control (EtOH)- and E2-treated H1793 (top two rows) and A549 (bottom two rows) cells for P-ser118-ERα (green) and cyclin D1 (red). Cells were counterstained with DAPI (blue) to image nuclei. Scale bar, 80 μm. The red and green scales with Max 5 and Min 1 indicate variation in staining intensity with P-ser118-ERα and cyclin D1 antibodies. (B) Examination of P-ser118-ERα (green) and cyclin D1 (red) in individual cells, counterstained with DAPI (blue) during the indicated phases of the cell cycle after 6 hours of treatment with 10 nM E2. Images were captured using identical exposure times. Scale bar, 20 μm.

