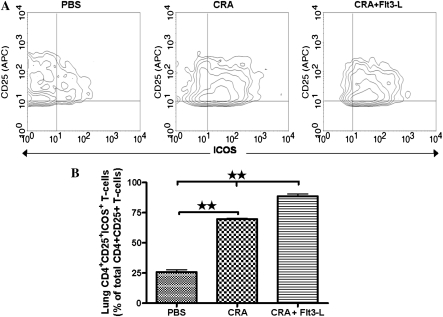
Figure 6.
Expression of inducible costimulatory molecule (ICOS) on CD4+CD25+ T cells. Contour plots showed a comparative analysis of ICOS expression on CD4+CD25+ T cells isolated from lungs of PBS, CRA, and CRA/Flt3-L (A). Statistical analysis of ICOS expression of each experimental group and Flt3-L–treated mice exhibits a significant increase of ICOS expression compared with CRA and PBS mice (B) (**P < 0.001).

