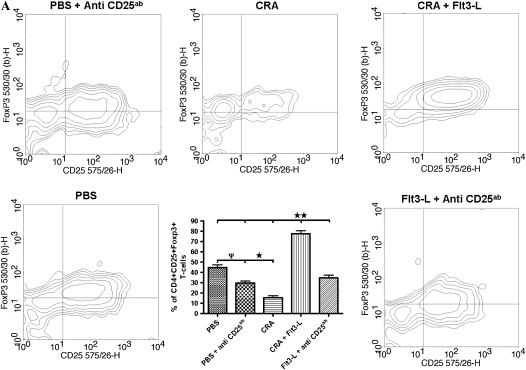
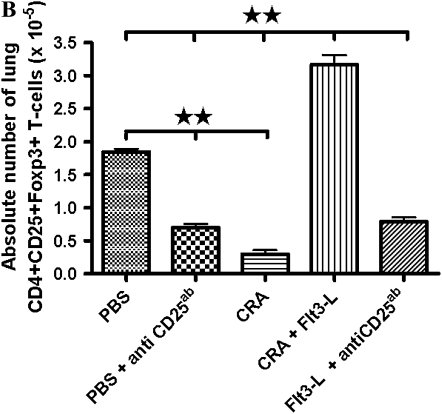
Figure 8.
Intracellular protein expression of Foxp3 and the number of lung CD4+CD25+ after Flt3-L and PC61 treatment. (A) Contour plots of CD4+CD25+ T cells that are representative of all five groups. Foxp3 expression was significantly expressed in the PBS control compared with a substantial decrease in the CRA and PBS mice with PC61. Flt3-L–treated mice with PC61 showed significant decrease in Foxp3 on lung CD4+CD25+ T cells; however, Foxp3 was restored after Flt3-L treatment only (*P < 0.01; ΨP < 0.05; **P < 0.001). (B) In cockroach-sensitized and -challenged mice treated with Flt3-L, there was a significantly increased number of lung CD4+CD25+Foxp3+ T cells compared with sensitized mice without Flt3-L. This effect was completely inhibited by PC61, with a significant decrease in the number of lung CD4+CD25+Foxp3+ T cells (** P < 0.001).


