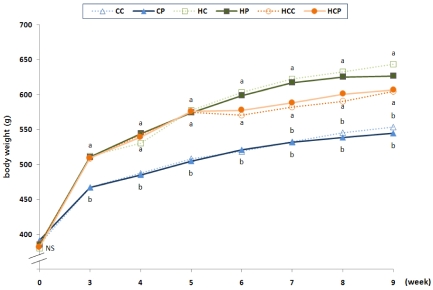
Fig. 1.
Changes of body weight during the experimental period. CC: 10% fat control, CP: 10% fat with γ-PGA, HC: High fat control, HP: High fat with γ-PGA, HCC: 45% to 10% fat control, HCP: 45% to 10% fat with γ-PGA. All points represent means, n=10 rats per group. Different letters in the same week indicate significantly different values assessed by Duncan's multiple range test (P < 0.05).

