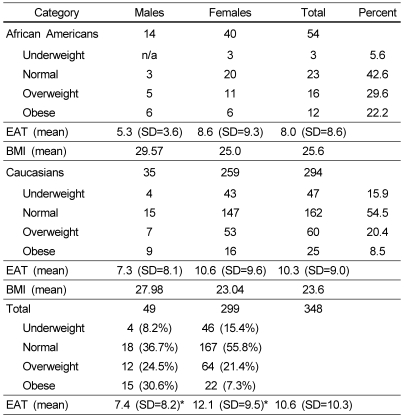
Table 3.
Description of BMI category, mean and standard deviation of EAT-26 (dieting behavior) scores for gender and ethnicity (sub-sample n=348)
Note: *Means comparison using a t-test revealed that EAT scores of females were significantly higher than those of males, t (344) = - 5.21, P ≤ .001
n/a: no available cases to report in this category

