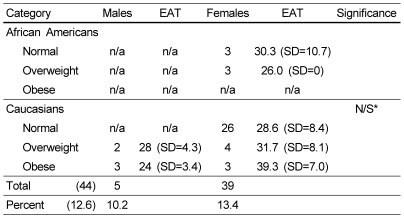
Table 4.
Means and standard deviations of eating attitudes scores (EAT 26) divided by BMI category for each gender and ethnicity of college students who scored over 20 (clinical cut-off for disturbed dieting behavior, n=44).
Note: *No significant difference was found between genders and weight category among students with EAT score over 20.
n/a: no available cases to report in this category

