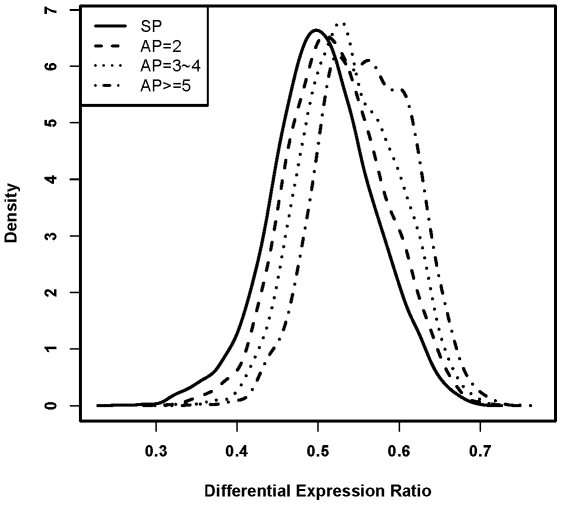
Figure 1. Distribution of differential expression ratio for each gene class.
The figure (density plot) showed that genes with more alternative promoters are more likely to be differentially expressed. SP means gene with single promoter, while AP = 2, AP = 3∼4, and AP> = 5 means gene with only 2 promoters, 3 or 4 promoters, and at least 5 promoters, respectively.

