
Figure 3.
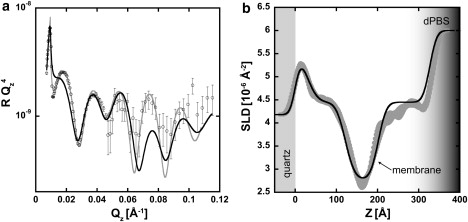
NR data and SLD profile for a high cell surface density sample. (a) NR data are shown with open circles and error bars that indicate 1 SD. The model-dependent fit is shown in black and the model-independent fit is shown in gray. (b) The corresponding SLD profiles for each fitting method. The model-independent method produces a family of SLD profiles (gray ribbon) where no curve differs from the lowest found χ2 value by more than χ. The shading between 300 and 400 Å (b) represents the transition from hydrogen-rich material adjacent to the membrane to bulk dPBS in the cells' interior.