
Figure 5.
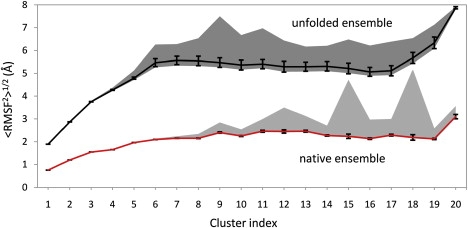
Arithmetic mean, standard deviation and extreme values of quadratic means of RMSF for every cluster. <RMSF2>1/2 values for every cluster were calculated using Eq. 8, using every structure in the cluster for the alignment before calculation. The lower curve shows arithmetic means of the distributions of quadratic means for native structure clusters. The upper line captures the values for the unfolded structures. Standard deviations of the distributions are shown with black bars. Extreme values and their differences are shown with a light gray area for the native ensemble and with a dark gray area for the unfolded one.