
Figure 3.
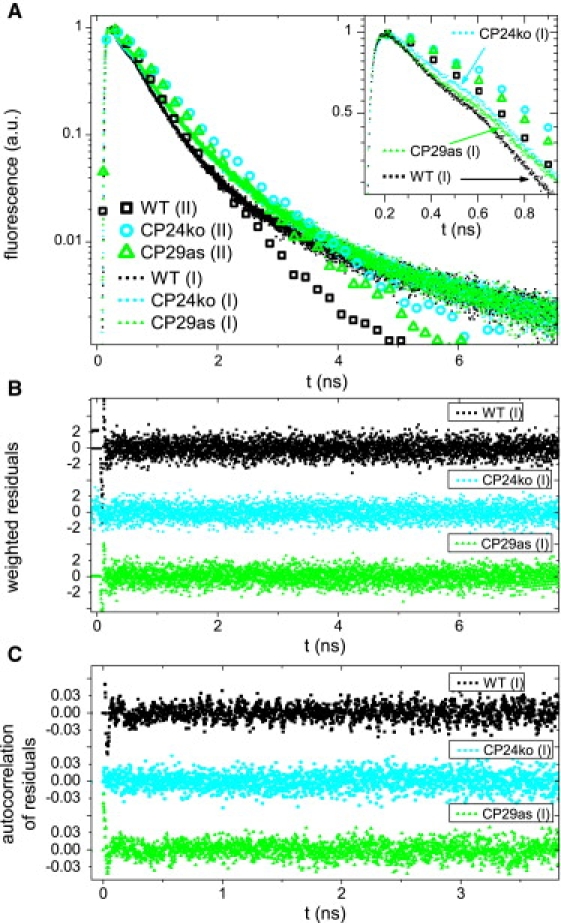
Time resolved fluorescence of thylakoid membranes from WT and mutants of A. thaliana, for two combinations of excitation/detection wavelengths: 412 nm/720 nm (dots labeled (I)) and 484/680 nm (open symbols labeled (II)). For (I) relatively more excitations are created in PSI and PSII core and relatively more PSI emission is detected; For (II) relatively more excitations are created in the PSII outer antenna. (A) Normalized fluorescence decay curves (symbols for every 200th data point). Inset: initial part of the decay curves (symbols for every 100th data point). (B) Weighted residuals of the fits of the decay curves in A. (C) Autocorrelation of the weighted residuals. (B and C) Used to evaluate fit quality. The complete curves for 484 nm/680 nm are presented in Fig. 2. The data of CP26ko are omitted for readability.