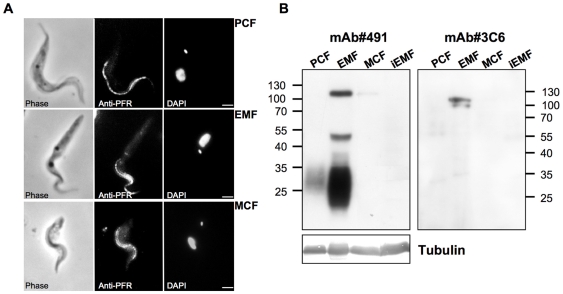
Figure 3. Morphological features and molecular markers analysis during metacyclogenesis.
A, Wild-type individual IL 3000 cells were labeled with monoclonal anti-PFR antibody during metacyclogenesis. For orientation the fixed cells were also stained with 4,6-diamino-2-phenylindole (DAPI) and visualized in phase contrast. Scale bar = 1 µm. B, Western blot analysis of stage specific markers during the metacyclogenesis. 106 cells of IL3000 were loaded per well. Tubulin was used as a loading control. Molecular weights are indicated on the blots side. iEMF: induced EMF in the absence of serum. Identical results were observed with the other T. congolense isolates and with transfected parasites.

