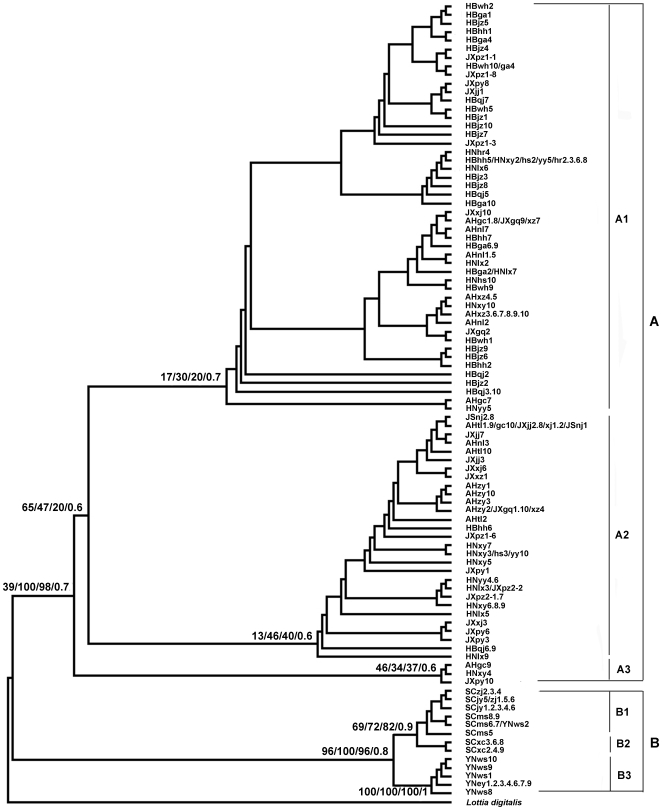
Figure 3. Phylogram of Oncomelania hupensis based on ITS1–ITS2 sequences.
Values beside the branch represent proportions of 1000 bootstrap pesudoreplicates and posterior probabilities in which the node was recovered for ML/NJ/MP/BI, respectively. The letters after each branch represent different sampled individuals coded by locality letter followed by sample isolate number, and samples in one branch shared one haplotype.

