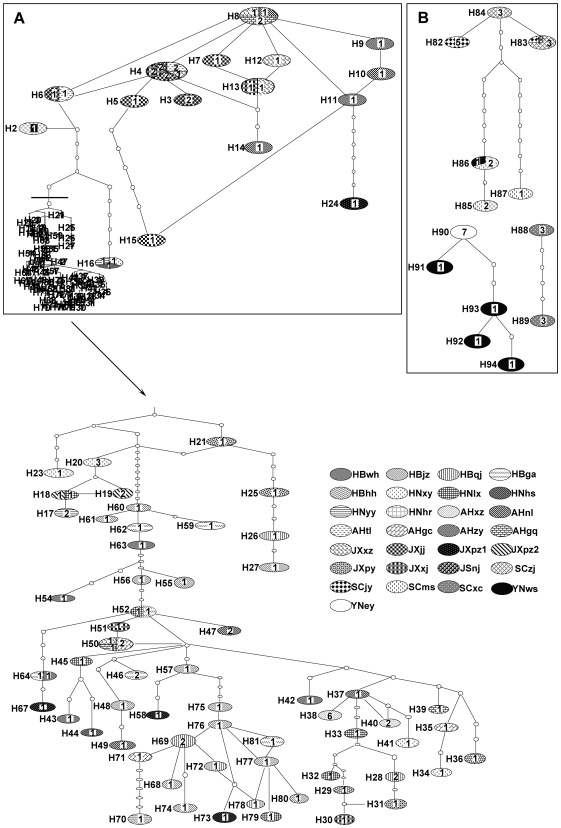
Figure 4. Unrooted parsimony network of ITS–ITS2 sequence haplotypes for Oncomelania hupensis.
Ovals indicate sampled haplotypes, which have designated numbers beside them. Numbers inside ovals indicate sample numbers from different geographical populations which shared the same haplotype. Small circles indicate unsampled or extinct haplotypes. Each connection represents one mutational step. A and B (B1, B2 and B3) refer to the corresponding clades in Fig. 3, respectively. The branch under the dark line in clade A is expanded below, as indicated by the arrow.

