
Figure 5.
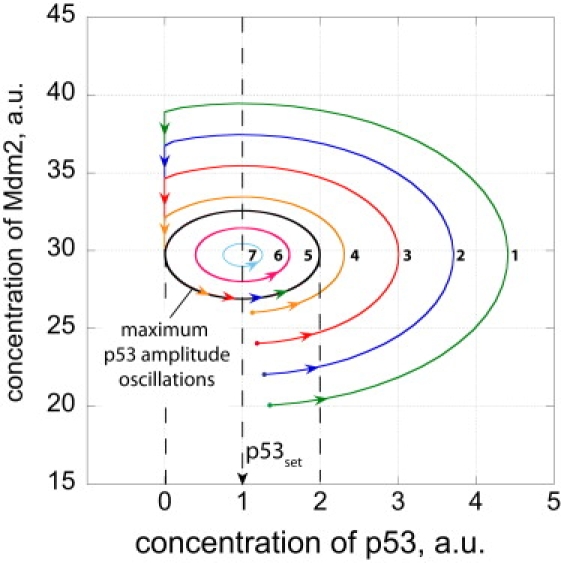
Phase plane trajectories of p53-Mdm2 harmonic oscillations going through three cycles. Rate constants as described in the legend of Fig. 4. To illustrate that ksp53 can be chosen without affecting the p53 oscillations around p53set, ksp53 was set to 11.0, and . For the sake of simplicity, all ks,r,dp53lowast; and ks,r,dMdm2lowast; rate constants are set to zero. Dots show different p53 and Mdm2 start concentrations. Because the system is conservative, parallel trajectories 1–7 emerge from each of the starting points. Trajectories 1–4 which lie outside of trajectory 5 (which is tangenting the ordinate at p53 = 0) will hit the ordinate at low p53 levels and Mdm2 concentrations will decrease until the system emerges as trajectory 5 oscillations, which have the largest peak amplitude equal to the p53 set-value. Trajectories 6 and 7 which start inside of trajectory 5 will not be altered, and the system oscillates with peak amplitudes lower than the p53 set-value.