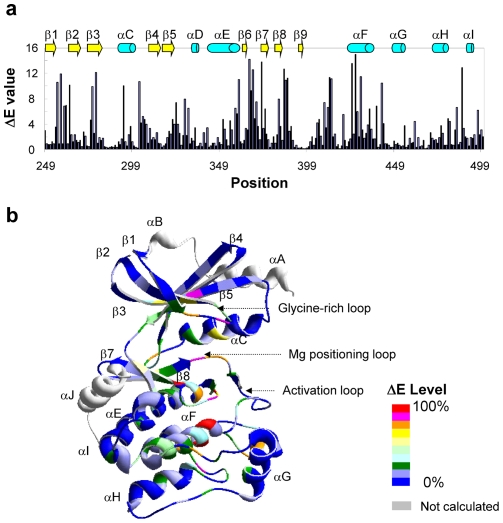
Figure 1. The evolutionary conservation values (ΔE) for Pak2.
(a) The Pak2 evolutionary conservation values (ΔE) for amino acids in the catalytic domain (residues 249 to 500). Residue numbers are those for Pak2. (b) The evolutionary conservation values were normalized to percentage and mapped on the tertiary structure of Pak1 (1YHV.PDB), which is highly homologous to Pak2. The levels of ΔE are shown in the color index. The secondary structures, α-helices A-J and β-sheets 1–9, are identified in (b).

