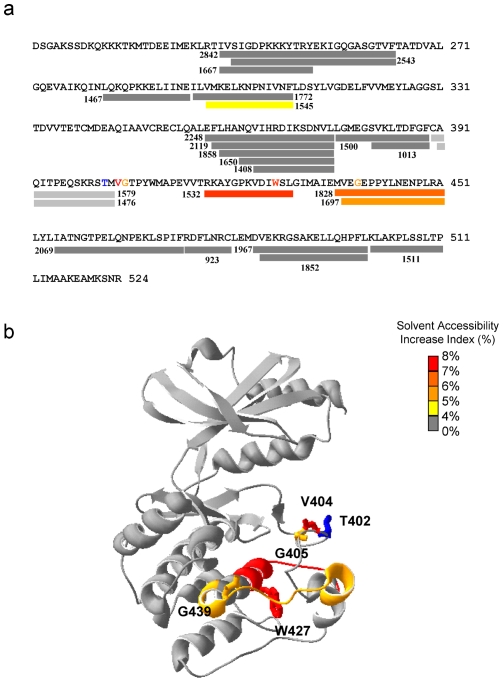
Figure 6. Differences in solvent accessibility between caspase-cleaved non-phosphorylated and autophosphorylated Pak2.
(a) The colored bars illustrate the solvent accessibility changes in the primary sequence. The numbers show the mass (M/Z) of the peptic peptides with a measurable MALDI-TOF signal after H/D exchange. An increase of solvent accessibility following autophosphorylation is shown as the solvent accessibility index. Two fragments (light gray bars), m/z 1476 and 1579, containing Thr402 disappeared after phosphorylation. (b) The differences in solvent accessibility are shown on crystal structure of Pak1 (1YHV.PDB). Residues, Trp427 (red) and Gly439 (orange), were statistically coupled to Thr402 (blue). Trp427 and Gly439 were in the fragments m/z 1532 and 1828 that had increased solvent accessibility after autophosphorylation.

