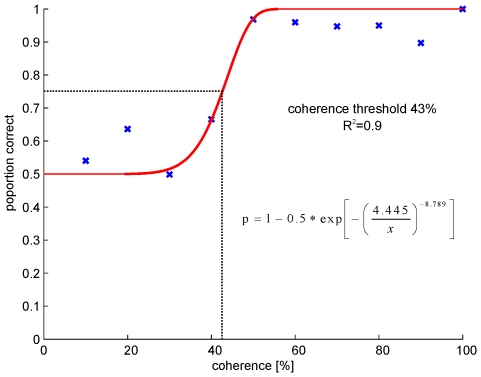
Figure 9. Psychometric function, which describes the sensitivity of the OMR to different coherence levels.
The proportion of correct choices by the model is plotted against increasing coherence levels. The correlation level is the normalized area under the corresponding receiver operator curve (ROC). The red line corresponds to the fitted sigmoidal function. Threshold was estimated at the coherence level at which the model predicted 75% correct (dash dotted line). R2 corresponds to the coefficient of determination.

