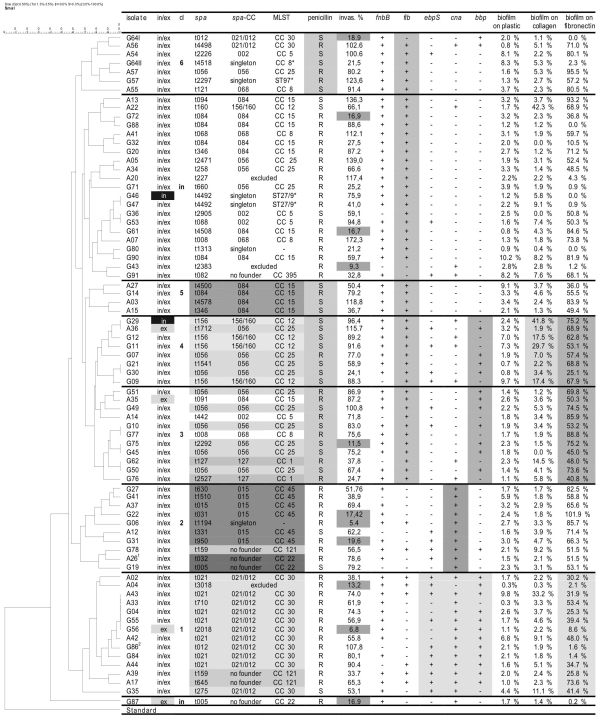
Figure 1. UPGMA-tree of PFGE patterns and group-associated characteristics of S. aureus isolates from RT patients.
The consensus tree was constructed by interpreting PFGE-band patterns with help of the GelCompar™-Software (version 4.1, Applied Math) using the UPGMA algorithm with Dice coefficients. Based on this consensus tree and taking the screened parameters listed in this table into account 6 clusters and a group of “independent” or unrelated strains can be distinguished; Legend: in/ex–intracellular/extracellular location according to the antibiotic protection assay, dark/grey fields denote the exclusive presence at the intra-/ extracellular location; cl–cluster number, in–independent strain, spa–spa-type; spa CC–spa-clonal cluster; MLST–Multi-Locus-Sequence-Typing clonal clusters, MLST-CCs were deduced from BURP grouping of spa-typing; ST–Sequence Type; penicillin–penicillin susceptibility (S-susceptible, R-resistant); invas. %–invasive character of the isolate in the FACS-based invasion assay, cut off: <20% value relative to the corresponding value of S. aureus strain Cowan I during the same series of experiments, grey fields denote non-invasive strains; fnbB–fibronectin binding protein B; fib–fibrinogen binding protein; ebpS–elastin binding protein; cna–collagen binding protein; bbp–bone sialoprotein binding protein, (note: 100% of the isolates were positive for clumping factor A & B (clfA, clfB) fibronectin binding protein A (fnbA) and laminin binding protein (eno)), biofilm formation of the RT-associated S. aureus isolates in relation to S. aureus strain ATCC 25923; (The different gray shaded boxes indicate groups of isolates with above average frequency of the certain parameter) 1 MRSA; 2 small colony variant.

