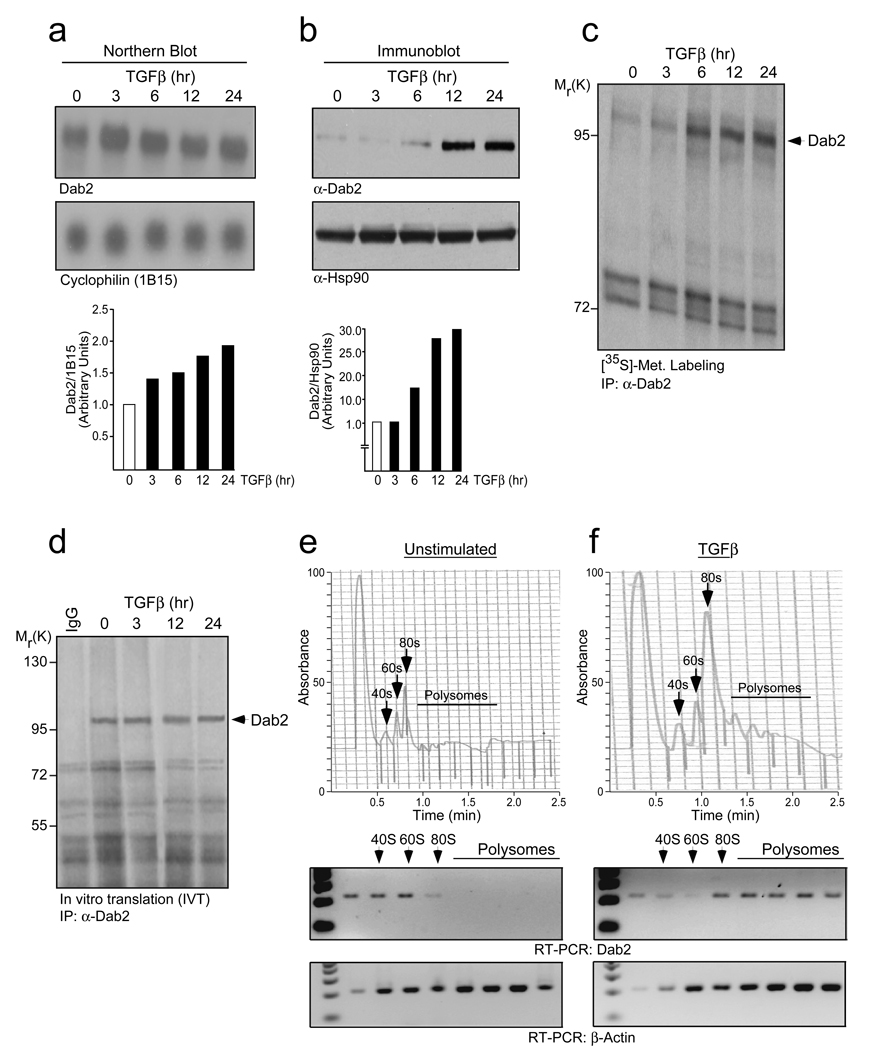
Figure 1.
TGFβ translationally up-regulates Dab2 expression. (a) Northern blot analysis examining Dab2 expression levels in NMuMG cells treated with TGFβ for the times indicated. Lower panel represents the quantification of band intensities analyzed by NIH Image J software. Dab2 band intensity was normalized to cyclophilin (1B15), then normalized to the t=0 unstimulated. (b) Immunoblot (IB) analysis examining Dab2 protein levels in NMuMG cells treated with TGFβ for the indicated times. Lower panel represents the quantification of band intensities analyzed by NIH Image J software. Dab2 band intensity was normalized to Hsp90, then normalized to the t=0 unstimulated. (c) Metabolic labeling with [35S]-methionine analyzing the de novo rate of Dab2 synthesis post-TGFβ stimulation. (d) Dab2 mRNA stability analysis by in vitro translation (IVT) of total RNA isolated from NMuMG cells treated with TGFβ for the times indicated followed by immunoprecipitation (IP) with α-Dab2 antibody and mouse IgG. (e) & (f) Translocation of Dab2 mRNA from the non-polysomal to polysomal pool was analyzed by semi-quantitative RT-PCR of RNA isolated from each fraction following polysome profiling. Full scans of (a), (b), (c) and (d) are shown in SI Fig. 7.

