
Figure 2.
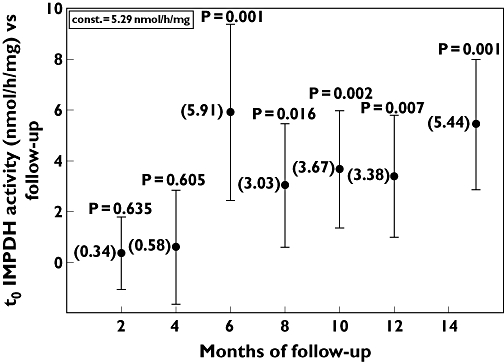
Variation over time of t0 inosine 5′-monophosphate dehydrogenase (IMPDH) activity during the monitoring period. Data are coefficients of a linear regression model adjusted for treatment group and for time since the start of mycophenolate mofetil (MMF) therapy. Constant (const.) and P shown at each time are the comparison vs. time 0. Constant 5.29 nmol h−1 mg−1 is the intercept of the regression model. Bars indicate the 95% confidence interval