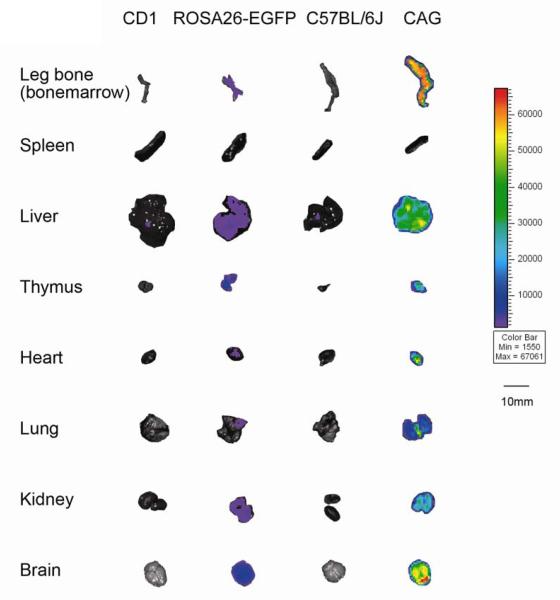
Figure 2.
Comparison of EGFP expression from intact organs of ROSA26-EGFP and CAG transgenic mice and their corresponding wild-type background strains (to determine non-specific fluorescence) as measured by ex vivo imaging immediately after sacrifice. Organs represent animals from Experiment 2. Fluorescent intensity is recorded as photons/sec/cm2, and the color of the signal represents the amount of EGFP protein present.

