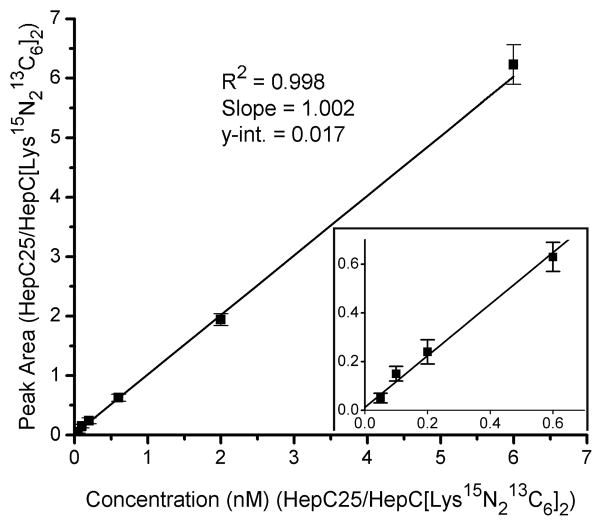
Figure 2.
Linearity of HepC-25 quantification using a urine sample without detectable hepcidin, a single internal standard concentration (50nM), and a series of HepC-25 synthetic peptide calibrants (2.5 – 300 nM). The ratio of average peak area of HepC25/HepC([Lys15N213C6]2) is plotted against the ratio of known HepC25/HepC([Lys15N213C6]2) concentrations (nM), and the resulting relationship is fitted with a linear regression. The slope (1.002) and y-intercept (0.017) indicate the absence of significant matrix effects or proportional error in the urine background.

