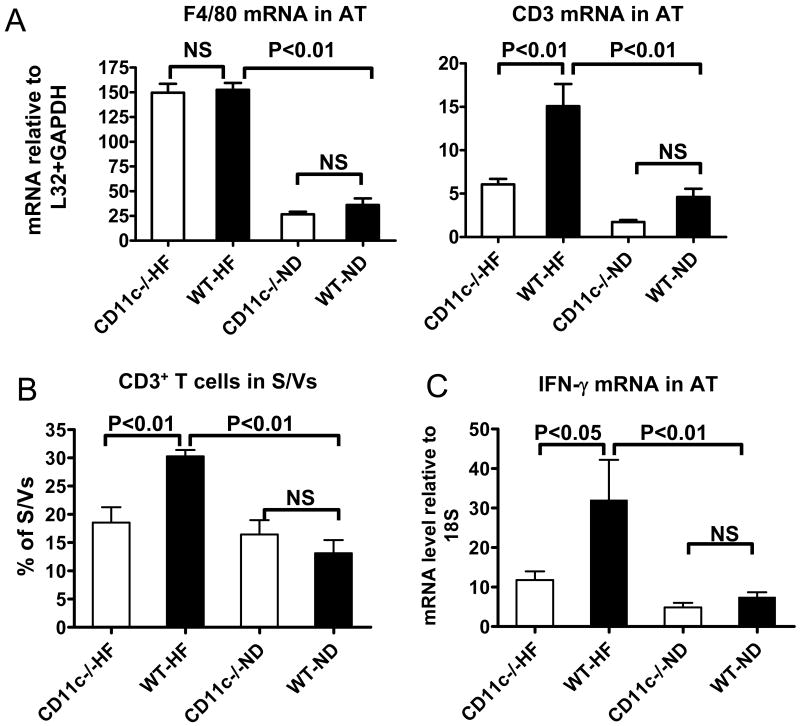
Figure 4. T cells in AT of CD11c−/− and WT mice.
A: mRNA levels of CD3 and F4/80 in AT of CD11c−/− and WT mice examined by RPA; n=10/group. B: Total T cells in AT of CD11c−/− and WT mice examined by FACS analysis; n=8 each for CD11c−/− and WT mice on HFD, and n=5 each for CD11c−/− and WT mice on ND. C: IFN-γ mRNA in AT of CD11c−/− and WT mice on HFD or ND as examined by quantitative RT-PCR; n=12–15/group. NS: not significant.

