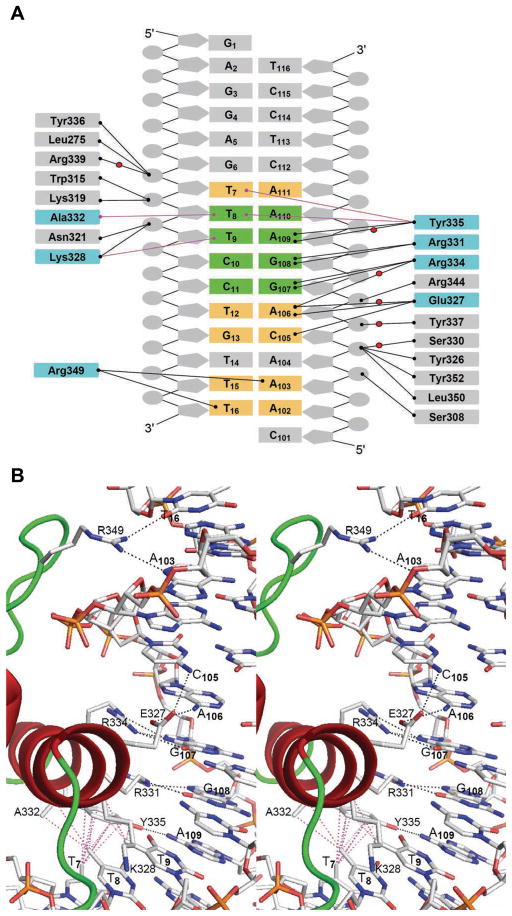
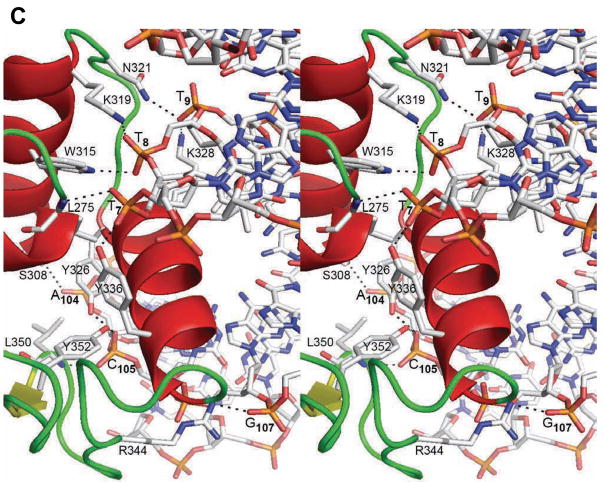
Figure 3.
A summary of the Elf3·mTβR-IIDNA interactions. (A) A schematic representation of protein·DNA interactions. Hydrogen bonds are shown with black lines and van der Waals contacts are shown with magenta lines. Water molecules are represented by red balls. The DNA base pairs in the B-site core region are highlighted in green and DNA base pairs outside the core region that interact with the protein are highlighted in yellow. The Elf3 sequences involved in contacts with DNA bases are highlighted in cyan. (B and C) A stereoview of protein·DNA interface showing the details of Elf3’s direct interactions with (B) DNA bases and (C) DNA backbone. The hydrogen bonds are drawn with black dashed lines and the van der Waals interactions are drawn with dashed magenta lines.


