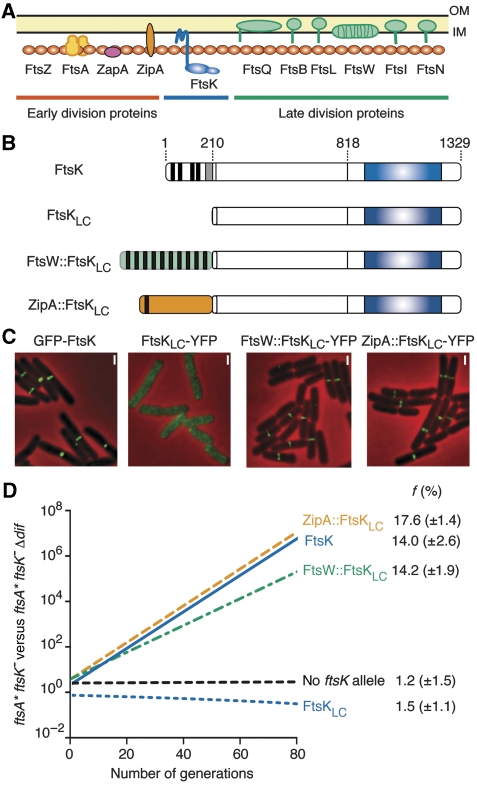
Figure 2.
Localization and chromosome dimer resolution activity of FtsKLC chimaeras. (A) Schematic view of septum assembly. The protein icons are ordered from left to right according to the commonly accepted assembly sequence. OM, outer membrane; IM, inner membrane. (B) Schematic representation of the FtsKLC chimaeras as in Figure 1B. (C) Localization of FtsKLC chimaeras fused at their C-terminal ends to YFP and of full-length FtsK fused at its N-terminal end to GFP in ftsK+ cells. A similar localization pattern was observed in ftsA* ftsK− and in ftsKLC− cells (data not shown). (C) Pictures of ftsK+ cells are shown because of their simpler cell division phenotype. Scale bars (white bars), 1 μm. (D) Growth competition between ftsA* ftsK− and ftsA* ftsK− Δdif cells. The graph of a typical result is shown. f, mean and standard deviation of the growth advantage given by the ectopic production of each FtsKLC chimaera (result from three independent experiments).

