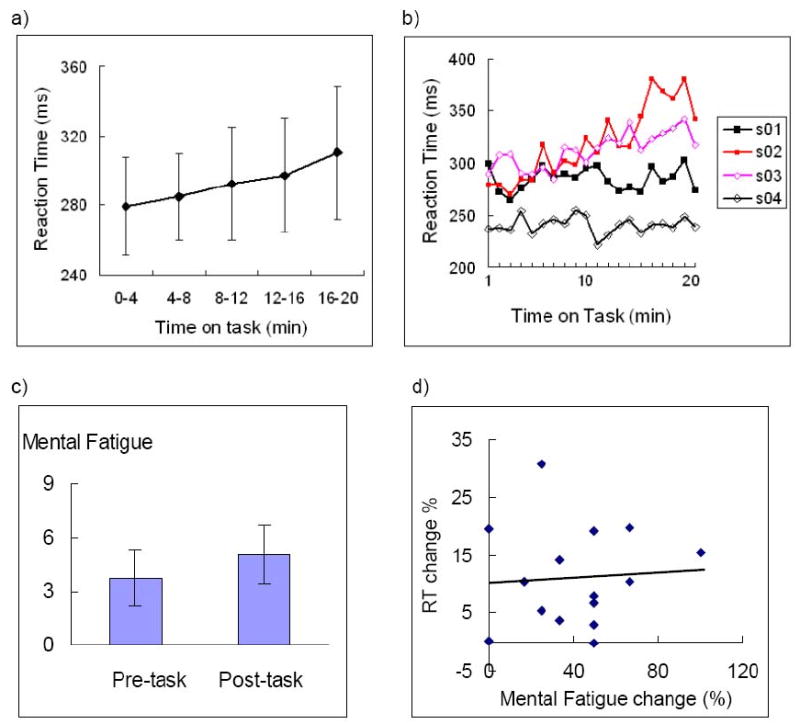
Figure 1.

a) Means and standard deviations of reaction time (RT) from the first to the last 4-minute quintiles; b) RT time series of four subjects from the first minute to the last minute of the 20-minute PVT. Note that there were robust individual differences in the rate of RT increases. c) Mean mental fatigue scales reported by subjects before and after the PVT. Note both RT and mental fatigue scales showed significant time-on-task effects. d) Self-reported mental fatigue scale changes showed no correlation with RT changes (r = 0.66, p > 0.9)
