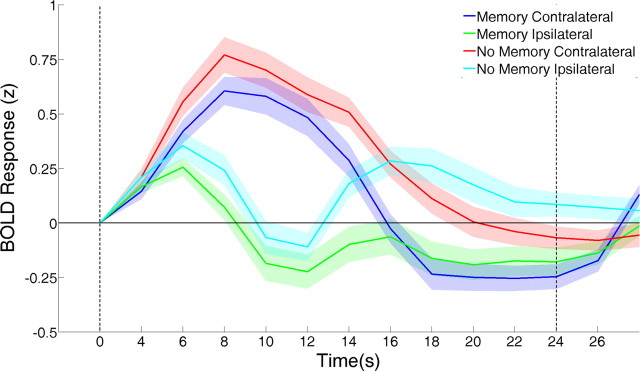
Figure 3.
Event-related analysis of WM data. The mean response of the 60 most spatially selective voxels in V1 (collapsed across hemispheres) is shown as a function of memory condition and ROI. Data are collapsed across stimulus orientation (i.e., 45° vs 135° trials) because no differences in mean response amplitude attributable to this factor were observed. Dashed vertical lines at 0 and 22 s denote the onset of the sample and test stimuli, respectively. Shaded regions represent ±1 SEM.

