
Figure 4.
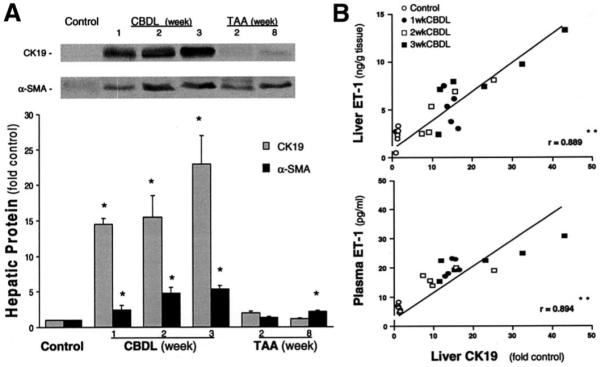
Liver CK19 and α-SMA protein levels in CBDL- and TAA-treated animals and correlation of liver CK19 levels with liver and plasma ET-1 levels in CBDL animals. (A) The top panel shows representative liver CK19 and α-SMA immunoblots, and the bottom graph summarizes Western blot results. Single bands of approximately 40 kilodaltons for CK19 or 42 kilodaltons for α-SMA were seen. Values are expressed as means ± SE (n = 5–7 animals for each group). *P < .05 compared with normal controls. (B) The relation between liver CK19 content and liver or plasma ET-1 levels in control and CBDL animals. The linear correlation coefficient (r) was significant for each comparison. **P < .0001.