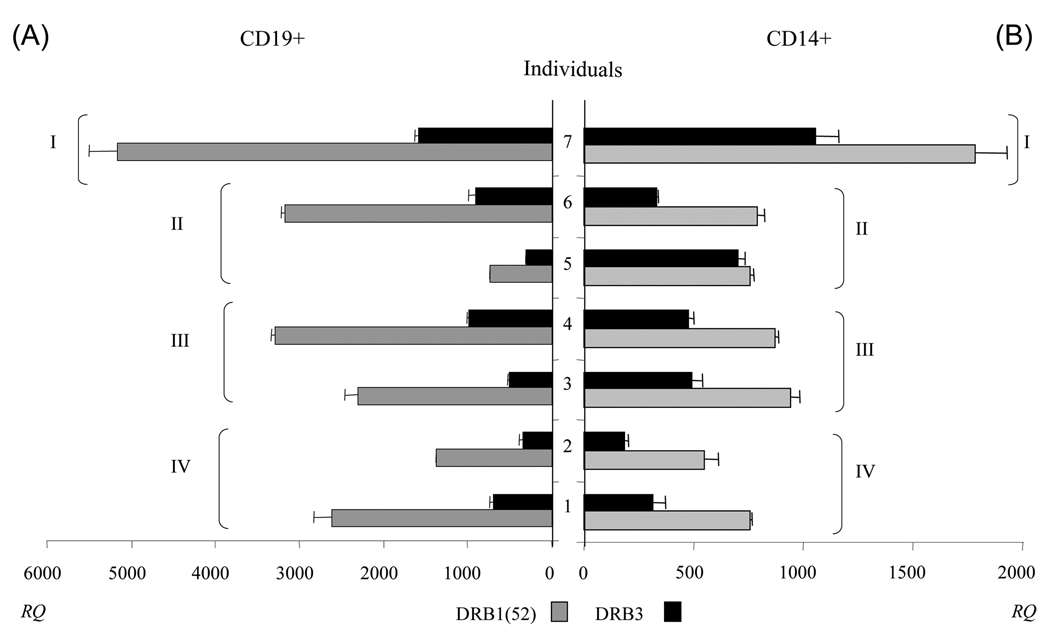
Figure 1. Level of expression of DRB1-52 and DRB3 on CD19+ cells and on CD14+ cells.
Level of DRB1-52 and DRB3 in CD19+ (A) and CD14+ (B) cells (see Supporting Information Table 1 for donor information). Data are expressed as ratio of DRB1 (grey) or DRB3 (black) to GAPDH × 105 copy numbers, and referred to as RQ. Data show mean + SD (n=3). I: donor with DRB1*0301/*1301 - DRB3*0101/*0101 typing; II: donors with DRB1*0301 and DRB3*0101 typing; III: donors with DRB1*1301 and DRB3*0101 typing; IV: donors with typing DRB1*1101 and DRB3*0202 typing. The paired comparison (two tailored Wilcoxon signed test) of DRB1 and DRB3 mRNA in both cell populations indicated that DRB1-52 is expressed at significantly higher levels (p=0.0078) than DRB3.

