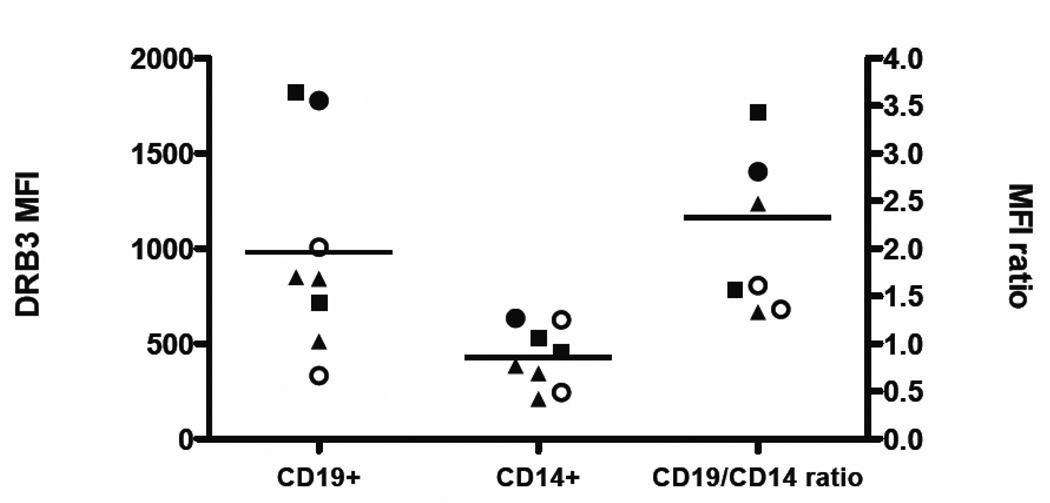
Figure 2. Mean fluorescence intensity (MFI) observed for DR52 antibody staining.
The observed MFI for DRB3 antibody staining in seven donors is plotted for CD19+ cells (left), CD14+ cells (middle) with mean values indicated by horizontal lines. The CD19+/CD14+ ratio (right) is also plotted. Symbols in all the representations stand for donors typing, open circles for DRB1*13-DRB3*0101, filled triangles for DRB1*11-DRB3*0202, filled squares for DRB1*03-DRB3*0101 and filled circles for DRB1*03/13-DRB3*0101/0101. The level of DRB3 MFI was higher on B cells than on monocytes, p=0.0148 (two tailored Wilcoxon signed test).

