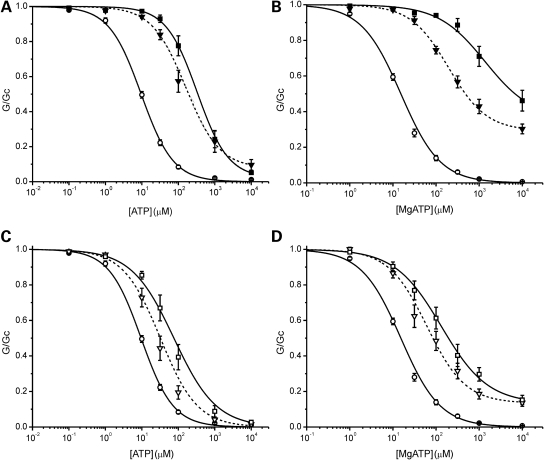
Figure 3.
Mutations in the same subunit. (A and B) Mean relationship between [ATP] and KATP conductance (G), expressed relative to that in the absence of nucleotide (Gc), for wild-type (WT, open circles, n = 13), homF60Y (filled squares, n = 7) and homF60Y/V64L (filled inverted triangles, n = 9) channels in the absence of Mg2+ (A); or for WT (open circles, n = 18), homF60Y (filled squares, n = 8) and homF60Y/V64L (filled inverted triangles, n = 12) channels in the presence of Mg2+ (B). The lines are drawn to Eq. (1), with the following parameters. (A) homF60Y/V64L (IC50 = 160 µm, h = 0.93, a = 0.08). (B) homF60Y/V64L (IC50 = 197 µm, h = 0.98, a = 0.29). Data and lines for WT and homF60Y are the same as in Figure 1. (C and D) Mean relationships between [ATP] and KATP conductance (G), expressed relative to that in the absence of nucleotide (Gc), for WT (open circles, n = 13), hetF60Y (open squares, n = 7) and hetF60Y/V64L (open inverted triangles, n = 7) channels in the absence of Mg2+ (C); or for wild-type (open circles, n = 18), hetF60Y (open squares, n = 9) and hetF60Y/V64L (open inverted triangles, n = 11) channels in the presence of Mg2+ (D). The lines are drawn to Eq. (1), with the following parameters. (C) hetF60Y/V64L (IC50 = 32 µm, h = 0.85). (D) hetF60Y/V64L (IC50 = 62 µm, h = 0.97, a = 0.13). Data and lines for WT and hetF60Y are the same as in Figure 1.

