Figure 8.
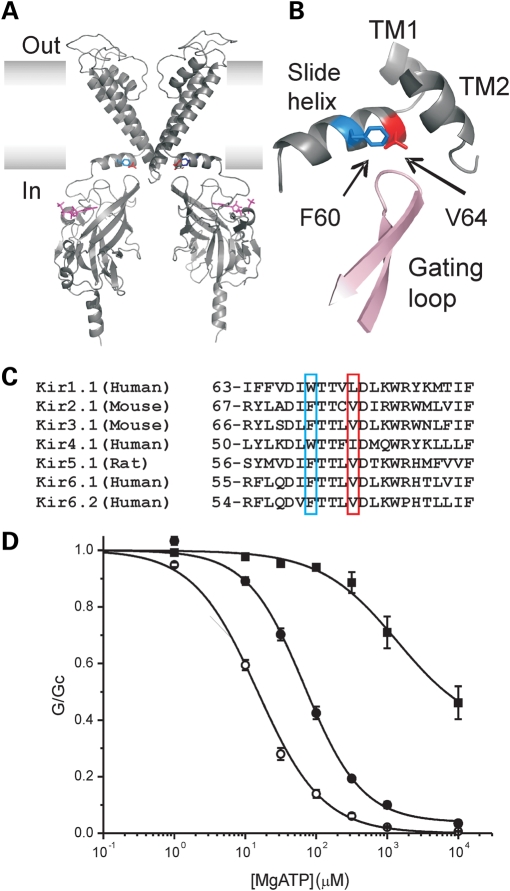
Molecular mechanism. (A) A molecular model of Kir6.2 (35) showing the location of residues F60 (blue) and V64 (red). For clarity only two transmembrane domains and two cytosolic domains are illustrated. ATP is shown in magenta. (B) A close-up of slide helix region showing the location of F60 and V64 and their proximity to the gating loop of adjacent subunit and transmembrane domains 1 and 2 (TM). Pink and grey indicate different subunits. (C) Alignment of the slide helix region for seven Kir channels. Residues corresponding to positions F60 and V64 in Kir6.2 are highlighted. (D) ATP concentration–response relations in the presence of Mg2+ for WT (open circles), homF60W (solid circles) and F60Y (squares) channels. For WT and homF60Y, the data are the same as in Figure 1B. The line for F60W is drawn to Eq. (1) with IC50 = 69 µm, h = 1.07, a = 0.04.

