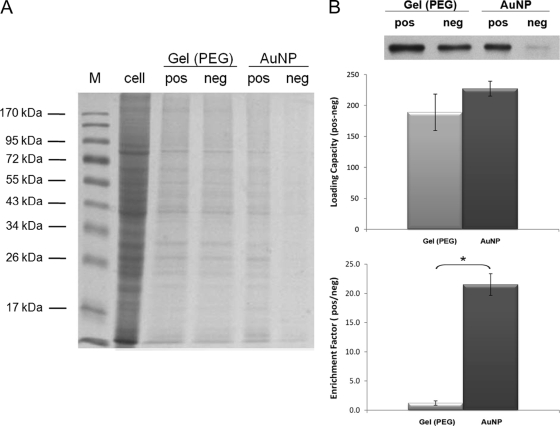
Fig. 3.
The pulldown from MCF-7 cells (100 μg of total protein) by 100 μl of AuNP-ERE and gel-ERE probe (positive and negative probes, respectively). A, nonspecific binding proteins of both probes were revealed by 10% SDS-PAGE stained with Coomassie Blue. “M” and “cell” lanes were loaded with protein marker and the total cell lysate without pulldown, respectively. B, ERα blotting data for the pulldowns. The loading capacity and enrichment factor were calculated by taking the difference and the ratio between the two pulldowns from the positive (pos) and negative (neg) probes. There is no significant difference in loading capacities (n = 3, p > 0.05), but there is a significant difference in enrichment factors (n = 3, p < 0.05). Significant differences are indicated with the star *, p < 0.05.

