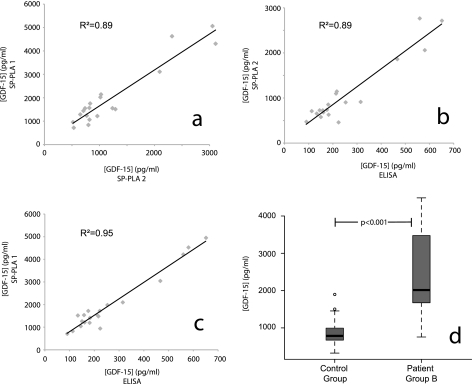
Fig. 6.
Measurements of GDF-15 in patient samples as analyzed in two independent SP-PLA tests and in one sandwich ELISA. a, GDF-15 was measured by SP-PLA in 20 human plasma samples obtained from patient group A on two separate occasions (SP-PLA1 and SP-PLA2). Values of GDF-15 in pg/ml obtained in assay 1 are plotted on the y axis, whereas values obtained from assay 2 are plotted on the x axis. b and c, scatter plots showing the correlation between ELISA and each of the two SP-PLA tests (SP-PLA1 and SP-PLA2) for data from the same 20 human plasma samples. Values of GDF-15 in pg/ml obtained from SP-PLA are plotted on the y axis, whereas ELISA values are plotted on the x axis. d, box plots showing differences in levels of GDF-15 in patients belonging to patient group B and in healthy controls. The p value was calculated using a two-sample Wilcoxon rank sum test.

