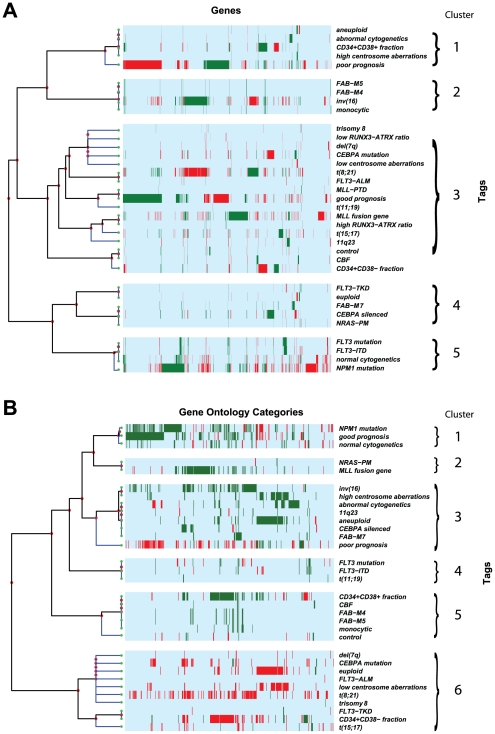
Figure 2. Hierarchical cluster analyses.
Strict up-regulation is green and strict down-regulation is red, while light blue represents no reported specific direction. Identification tag descriptions can be found in Table S1. (A) Hierarchical cluster analysis of the 3998 differentially expressed genes (x-axis) of AML prognostic categories (y-axis). For illustration purposes, we notated and manually separated 5 major clusters. Cluster 1 includes aneuploid, abnormal cytogenetics, CD34+CD38+ AML fraction, high centrosome aberrations and poor prognosis. Cluster 2 includes FAB-M4, FAB-M5, inv(16) and monocytic. Cluster 3 includes a large group of heterogenous identification tags. Cluster 4 identifies FLT3-TKD, euploid, FAB-M7, CEBPA silenced, and NRAS-PM. Cluster 5 includes FLT3 mutation, FLT3-ITD, normal cytogenetics and NPM1 mutation. (B) Hierarchical cluster analysis of the 541 differential GO categories (x-axis) of AML prognostic categories (y-axis). For illustration purposes, we notated and manually separated 6 major clusters. Cluster 1 includes NPM1 mutation, good prognosis and normal cytogenetics. Cluster 2 includes NRAS-PM and MLL fusion gene. Cluster 3 includes inv(16), high centrosome aberrations, abnormal cytogenetics, 11q23, aneuploid, CEBPA silenced, FAB-M7, and poor prognosis. Cluster 4 includes FLT3 mutation, FLT3-ITD and t(11;19). Cluster 5 includes CD34+CD38+ AML fraction, CBF, FAB-M4, FAB-M5, monocytic, and normal patient controls. Cluster 6 includes a large group of heterogenous identification tags.

