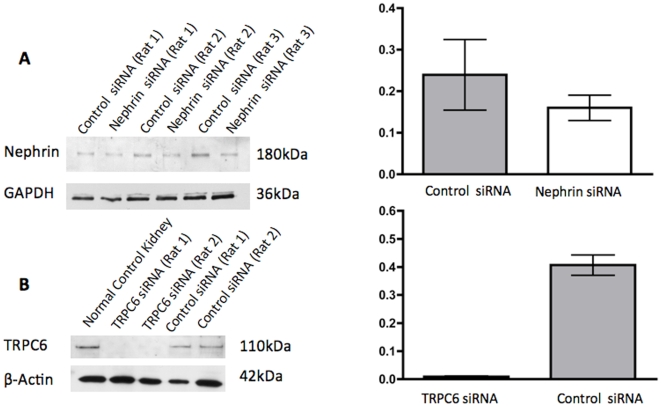
Figure 5. Western blot analysis for Nephrin and TRPC6 in rats injected with shamporter and siRNA.
Rats were injected via tail vein with shamporter + control siRNA or shamporter + nephrin siRNA or shamporter + TRPC6 siRNA. Compared with control siRNA injected rats, there was a significant decrease in nephrin protein levels in the rats injected with nephrin siRNA (A). Likewise, there was a significant decrease in TRPC6 protein levels in the rats injected with TRPC6 siRNA (B). Staining for GAPDH or beta actin was used as a protein loading control, and the podocyte specific protein podocin or nephrin were used to ensure that the same amount of podocyte protein was loaded. Densitometry and of the results are shown in the graph. Ratios were compared using t-test (p<0.05); ratios are expressed as median ± min and max values.

