Fig 3.
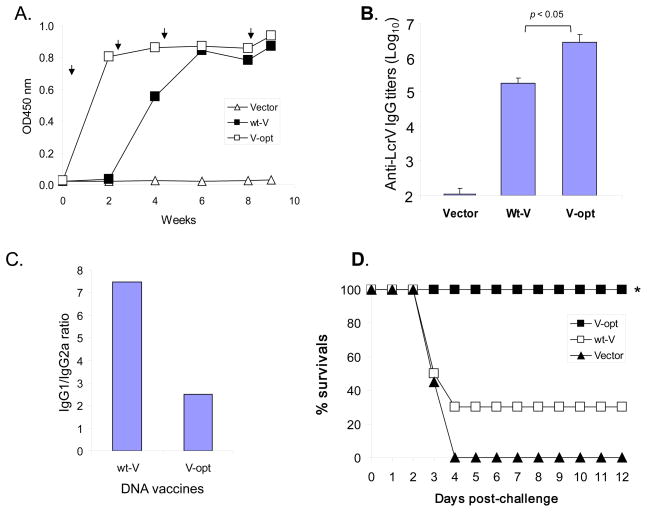
V-specific immune protection induced by V DNA vaccines. A. Temporal V-specific antibody responses of group-pooled sera at 1:500 serum dilution. The arrows indicate the time-points of DNA immunizations. B. Peak levels of V-specific antibody titers after the 4th DNA immunization. The data show mean titers with standard deviations of 10 Balb/C mice in each group. Statistical difference is indicated between V.opt and wt.V DNA immunization groups. C. The IgG1/IgG2a ratios in V.opt and wt.V DNA immunized mice at peak antibody responses. D. In vivo protections of mice immunized with different V DNA vaccines as indicated. The Balb/C mice were challenged with a lethal dose of 80000 cfu Y. pestis by intranasal inoculation at one week after the 4th DNA immunization. The percent of survival of each group of 10 Balb/C mice is shown. * indicates the significant difference (p < 0.05) of survival rates between V.opt and wt.V DNA immunization groups.

