
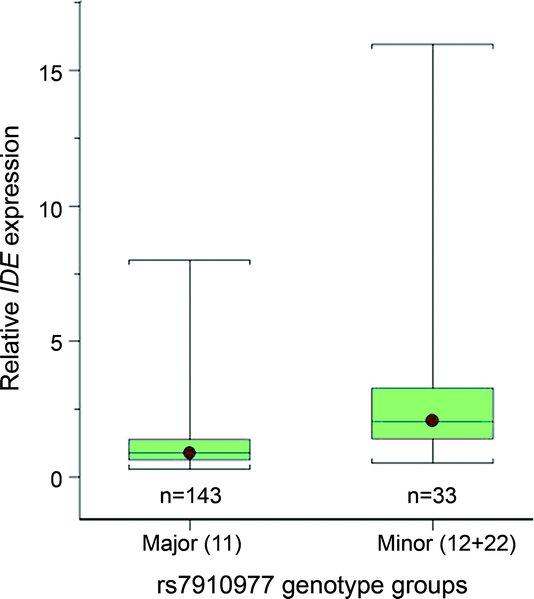
Figure 1 Relative IDE expression levels by rs7910977 genotypes
IDE expression levels relative to the mean of the major homozygotes are shown separately for the major homozygotes (11) and the minor allele carriers (12 + 22) of the IDE SNP rs7910977. Relative IDE expression levels for each subject were calculated using the 2-ΔΔCT method. The whiskers depict the smallest and largest data points for each box plot.